If you want to see how much traffic is passing through your network port there’s a handy tool called vnstat which will tally the amount of data passing through. You can install it with:
sudo apt-get install vnstat
It will usually add the databases and network ports automatically like so:
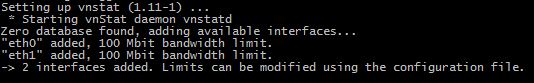
If it doesn’t and gives you an error you can create the database(s) with:
sudo vnstat -u -i eth0
If you have multiple network cards/ports you can add those in, too:
vnstat -u -i eth1
vnstat -u -i eth2
…etc
If it couldn’t create the databases you can start it with:
sudo /etc/init.d/vnstat start
If you need to change the maximum bandwidth from 100Mb you can edit the file:
/etc/vnstat.conf
Scroll down until you see the following:
# maximum bandwidth (Mbit) for all interfaces, 0 = disable feature
# (unless interface specific limit is given)
MaxBandwidth 100
and make MaxBandwidth the figure you require (e.g. 1000). If you make a change restart vnstat with:
/etc/init.d/vnstat restart
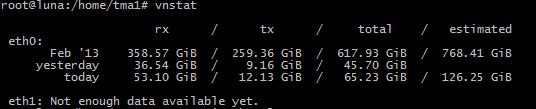
You can now see how much traffic has come through the NIC since vnstat started recording – at first it probably won’t be much (if any), but as it adds up you can check it with:
vnstat
The output should look like:
You can watch how much traffic is flowing through in real-time by running:
vnstat -i eth0 -l
This will give you a screen showing you the current traffic:
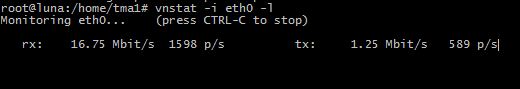
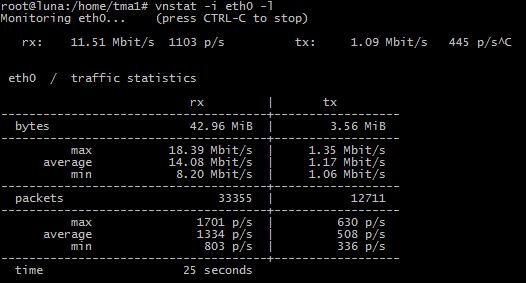
You can end this with CTRL+C, which shows you a summary screen:
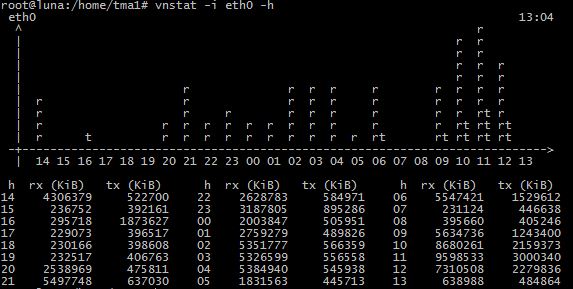
You can get an hourly summary with:
vnstat -i eth0 -h
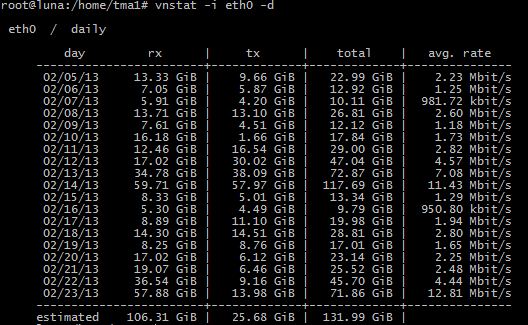
Daily summary with:
vnstat -i eth0 -d
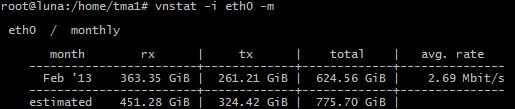
Monthly summary with:
vnstat -i eth0 -m
This is a really handy way of keeping track of your network traffic – whether it’s out of curiosity, wanting to know how much stress your network is under or looking for a bottleneck this can be quite a valuable tool.